



Jihun
Lee

Jihun Lee sitting by a cafe window

welcome to my site

Korea & APAC Market Entry · Data-Driven Strategy

UC Berkeley Statistics  ·  ex-Warner Music  ·  Seoul

↓
Artists whose market data I analyzed

Bruno Mars·Ed Sheeran·Christopher·Charlie Puth·FIFTY FIFTY

My story

From Reading Data to Opening Markets

Global companies entering Korea and the wider APAC region usually have two gaps: they do not know how local customers really behave, and headquarters cannot see what is happening on the ground. I have spent my career closing both gaps with data.

Chapter 1 · Berkeley, until 2015

A Berkeley statistician with a Korean home base

I graduated from UC Berkeley with a B.A. in Statistics. It gave me a habit I still rely on: before recommending anything, I check what the data actually says. Studying in the US also showed me how global teams think, present and make decisions, while my Korean roots help me understand how customers here think. That mix lets me explain Asian markets to headquarters, and headquarters to Asian teams.

Hypothesis testingRegression & correlationTime-series forecasting
Chapter 2 · Seoul, 2016–2021

Learning to read people through data

Back in Seoul I used data to understand people in very different settings. At a startup I scraped the web and tracked brand mentions to understand customers. At a training school I taught Korean office workers sales analysis and time-series forecasting. At Seoul National University Hospital I built SAS and SQL monitoring and worked with EU and Japanese research partners, my first cross-border project.

Data skills, as they were added
2016Web scraping, social listening, customer research
2020Sales forecasting with time-series models
2020–21SAS / SQL at scale, cross-border research with EU & Japan
2022–24Python automation, Tableau, BigQuery / Snowflake, market reporting
Chapter 3 · Warner Music Korea, 2022–2024

The Asia-facing desk of a global company

As Manager (Korea), Business Insights & Analytics, I was where global met local. Global artists such as Bruno Mars, Ed Sheeran, Christopher and Charlie Puth needed a Korean go-to-market plan, and I built it from local platform and social data. K-pop was moving the other way, so I also mapped where Korean music was consumed abroad, from the US to the Philippines, Indonesia, Mexico and Brazil, and worked with sales data spanning Korean, Japanese, Chinese, Hong Kong, Indonesian, Malaysian and Philippine repertoire.

My reports went to regional teams and shaped investment, release timing and promotion. In practice this was market entry work, repeated every release.

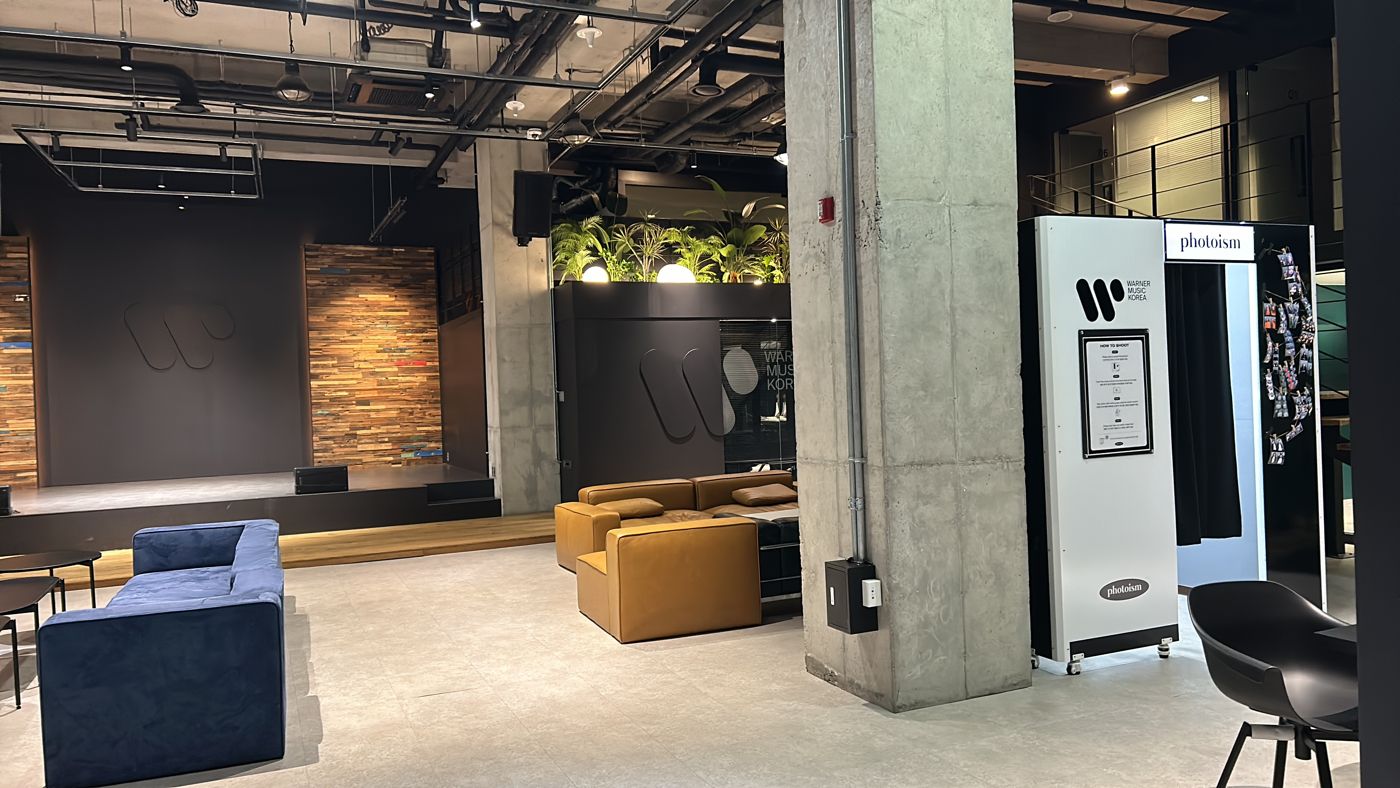
Warner Music Korea office lounge and stage in Seoul
Warner Music Korea, Seoul
Chapter 4 · Next

Helping global companies win in Korea and across APAC

I now want to do this work directly for companies entering the market: as a Korea / APAC Country or Market Entry Manager, or as an advisor. My promise is simple. You get a clear read of the market, the numbers to prove it, and a plan headquarters can approve.

See my playbook ↓
Portrait of Jihun Lee
Berkeley

B.A. Statistics, the analytical base of every recommendation

2+ yrs

Korea-market manager at a global company (Warner Music)

Hot 100

Billboard act assessed for investment eligibility

~240

aircraft covered when sizing in-flight music as a new B2B channel

My APAC Market Entry Playbook

Four steps I use to take a product into Korea and the wider APAC market. Each one is powered by data, and each one is backed by a real project below.

01

Size

How big is the prize, and where do we start? Bottom-up sizing from public and partner data, turned into a go / no-go case.

DataExcel models · chart data (~10K rows)

Proof: in-flight music sizing →
02

Localize

Which channel, which timing, which message? Local behavior data turned into launch timing and channel priorities.

DataPython · correlation analysis · weather × streaming

Proof: weather-timed recommendations →
03

Validate

Is the local partner, deal or asset worth the price? Fast, defensible due diligence before money moves, even on a Billboard-charting act.

Datacross-platform social data · custom ratio metrics

Proof: Billboard act investment review →
04

Report

Can HQ see the market every week? Automated KPI reporting in English for regional and global teams.

DataPython automation · SQL · Tableau

Proof: weekly market report →

All figures on this page are approximate: recalled from memory and rounded to show the approach, not exact results.

Playbook · Validate  cross-platform social data · custom ratio metric · YouTube engagement

Investment Eligibility Research on a Billboard Hot 100 Act:
Is FIFTY FIFTY a Breakout or a One-Hit Wonder?

Where we started

In spring 2023, FIFTY FIFTY's "Cupid" had just entered the Billboard Hot 100 and was exploding worldwide. Competitors were ready to bet big. I was asked to assess whether the act was investment-eligible: a lasting act, or a one-hit wonder? Streams alone could not answer it. Big streams can come from a song people love while barely noticing who sings it.

Two shapes I found in the data (illustration)
Lasting artistFollowers "cover the top" of streams
One-hit wonderStreams overwhelm followers
StreamsFollowers

Schematic of the patterns seen for Charlie Puth, GOT7 and Taylor Swift (left) versus GAYLE, Shaun and Pháo (right).

Finding the patterns

I compared the follower curve against the streaming curve for artists whose next release had already proven them. Artists who keep hitting show followers that sit above streams and absorb every spike. One-hit wonders show the opposite: a streaming peak that followers never catch up to. Then I built one number to compare acts directly: the follower acquisition rate, meaning daily followers gained across YouTube, Spotify, Instagram, TikTok and Twitter per global stream.

Followers gained per global stream · spring 2023 (approx.)
NewJeans~1.7
FIFTY FIFTY~0.3
Top-3 YouTube videosFIFTY FIFTYNewJeans
Views~27M~220M
Engagement rate~4.9%~1.5%
Follower share from TikTok~40%~30%

Engagement = (likes + comments) ÷ views, early April 2023.

What the numbers said

NewJeans gained about five times more followers per stream than FIFTY FIFTY. On TikTok, the most-viewed "Cupid" videos used the song as background audio. They were not fans introducing the group. There was a bright spot too: FIFTY FIFTY's YouTube engagement was three times NewJeans', which meant a small core fandom was really forming.

Jihun Lee with the members of FIFTY FIFTY
With FIFTY FIFTY

Our recommendation

Momentum was real, but fandom lagged far behind streams. I flagged one-hit-wonder risk and advised careful analysis before matching the large bids competitors were making.

The core idea is reusable: compare follower growth to streaming growth before investing in any viral act.

For a company entering APACHype in APAC moves fast. The same check (is there loyal demand behind the buzz?) applies to picking local partners, influencers and acquisition targets.

Playbook · Localize  Python · correlation analysis · ~23K tracks × KMA weather

Localizing Timing to Local Behavior:
Songs That Follow the Forecast

Where we started

The marketing team had a hunch: some songs rise when it rains. If that was true, recommendation lists and push timing could follow the weather. I set out to measure it across the entire catalog, not just a few favorites.

Correlation of daily streams with rainfall · domestic, Feb–Sep 2022
새벽공방 · Sun Shower (여우비)
0.72
럼블피쉬 · 비와 당신
0.68
공기남 · 비를 내려줘요
0.66
공기남 · 오늘, 비
0.64
류태열 · 비가 내려오네
0.58

Pearson r. The same songs move opposite to sunshine hours (r ≈ −0.53) and solar radiation (r ≈ −0.62).

How I did it

I joined daily streams with Korea Meteorological Administration data: temperature, rainfall, humidity, sunshine hours, solar radiation and wind. Then I correlated every track: ~17K domestic (Feb–Sep 2022) and ~6K international (Jan 2020–Sep 2022).

Most songs ignore the weather. Only about a dozen domestic tracks cross r > 0.5 with rainfall, which made the shortlist sharp enough to act on.

Outcome

A weather-sensitive track list that marketing used to adjust recommendations and push timing on rainy days.

Why it mattered

Instead of guessing, the team had a short, evidence-based list of rain songs and a clear signal (rainfall, low sunshine) for when to surface them.

For a company entering APACEvery market has its own rhythms: weather, seasons, holidays, platform habits. I find the ones that move your product and time the launch to them.

Playbook · Report  Python automation · 4 platform feeds · week-over-week change

Market Intelligence for HQ:
The Weekly Market Report, From 90 Minutes to 5

The problem

Every week the team needed to know how Warner's catalog moved on each Korean platform. Merging Melon, Genie, FLO and YouTube charts by hand took about 1.5 hours.

What I built

A Python pipeline that ingests each chart, splits international and domestic repertoire, computes week-over-week change and share, and writes a summary plus track-level sheets that flag the movers.

1.5 hr5 min

For a company entering APACHQ needs a reliable weekly read of markets it cannot see. I build that reporting once, automate it, and keep it in English.

Sample output · Melon, international · one week in autumn 2023
TrackThis wkLast wkΔ
Charlie Puth · I Don't Think That I Like~880K~970K−9%
Charlie Puth · Dangerously~810K~890K−10%
Zac Efron, Zendaya · Rewrite The Stars~690K~310K+121%
Charlie Puth · That's Hilarious~550K~650K−16%

The same weekly data also fed seasonal work, such as an R script that pulls holiday and winter songs from the Melon Top 500 by ISRC.

Playbook · Size

More Market Work

In-Flight Music Market Sizing
Korean Air · Asiana

What is in-flight music worth?

Estimated monthly licensing revenue across Korean Air (~160 aircraft) and Asiana (~80), using fleet data, Warner's average share across five platforms and the domestic/international repertoire split.

fee per aircraft × fleet × market share × settlement rate
DSP Settlement Scenarios
~2 years · 2021–2023

Contract condition modeling

Modeled Melon service data under alternative contract conditions: plays, revenue share, subscribers, per-play rate and domestic vs international settlement rates.

Monthly Subscription Tracker
Korean streaming market

Subscribers & share, every month

Tracked Korean streaming subscribers and label share by platform with year-over-year change, giving the team a monthly read on market size and share.

Pop vs K-pop Label Share
Circle Chart Top 200 · 2023

Market share from chart data

Converted ~10K rows of 2023 Circle Chart Top 200 into estimated sales and compared major-label share separately for pop and K-pop repertoire.

Experience

Jun 2022 – Sep 2024

Manager (Korea), Business Insights & Analytics

Warner Music Korea · Seoul, Korea
  • Managed weekly and monthly consumer behavior reporting using UGC data from YouTube, Instagram, and TikTok, tracking market trends to support commercial decisions.
  • Analyzed product consumption across Korean and global markets and built structured insight tables that made marketing campaigns more efficient.
  • Shaped Korea market entry and growth strategy for global artists (Bruno Mars, Ed Sheeran, Christopher, Charlie Puth) based on local consumption data, and partnered with key influencers to drive regional growth.
  • Presented market and consumer insights to regional teams, informing investment priorities, release timing, and promotional strategy.
  • Identified weather-sensitive products by analyzing the link between weather patterns and consumption, helping the marketing team optimize recommendation lists and timing.
  • Built a Python tool that automated weekly reporting, cutting a 1.5-hour task to 5 minutes (~70 hours saved per year).
Oct 2020 – Feb 2021

Data Manager

Seoul National University Hospital · Seoul, Korea
  • Monitored patient data for individuals taking specific medications, supporting clinical safety efforts.
  • Developed and implemented SAS and SQL macros for large-scale data monitoring and analysis.
  • Collaborated on international research with European and Japanese institutions.
  • Conducted research on optimal hospital matching using machine learning and decision tree models.
Jun 2020 – Oct 2020

Data Manager

4th Industrial Revolution School · Seoul, Korea
  • Facilitated sales data analysis training programs for office workers, emphasizing practical skills.
  • Generated sales forecasts using time series analysis to diagnose and enhance sales department strategies.
  • Evaluated prediction accuracy to assess forecasting model performance.
Jun 2016 – Dec 2017

Data Manager

Abroadway · Seoul, Korea
  • Conducted customer research through data-driven methods to uncover insights on consumer behavior.
  • Collected data using web scraping tools and analyzed user data for targeted insights.
  • Monitored brand popularity by counting name mentions on social media platforms.
Education

University of California, Berkeley

Bachelor of Arts in Statistics · May 2015

Market & strategy

Korea & APAC market sizingGo-to-market localizationPartner & contract modelingInvestment due diligenceHQ stakeholder reporting

Languages & data

SQLPythonRSASBigQuerySnowflake

Analysis

Time-series forecastingMachine learningStatistical analysisKPI reporting

Communication

TableauExcelPowerPointWord
Entering Korea or APAC? Let's talk.

Open to Korea / APAC Country Manager, Market Entry and Strategy roles, and to advisory projects for companies entering the region.

jihunlee@berkeley.edu